08/30/2023
In any medical situation, the very first steps include taking the patient’s vital signs – temperature, pulse, blood pressure, etc. These and other measurements are critical to knowing the health of the patient, hence their universal observation and notation. Two key questions are addressed in these readings: is the patient healthy and are they getting better or worse than before?
Cooling water and other plant utility systems have similar metrics that help us know if our systems are healthy and if they’re getting better or worse. Similar to the body, these include various temperatures and pressures as well as other factors such as energy input and directly measured or calculated output values enabling the assessment of the system’s operating level and efficiency1. Moreover, with plant utilities, a frequent question asked is how much more can be added to the existing systems, and good operating data can be essential to making this determination.
Unfortunately, we often forget the importance of the measurement tools and systems to the quality and usefulness of the readings, and consequently we are forced to analyze systems while using incomplete and / or inaccurate measurements. In many cases, it may not even be recognized that the data is not good, which is perhaps the worst situation. Unsurprisingly, this can lead to an incorrect understanding of system operations with resulting suboptimal decisions of appropriate actions and potential changes. In other words, “garbage in, garbage out”.
This article will discuss the instrumentation typically found in cooling systems and other plant utility systems, what other instruments and gauges should be used, how the instrumentation should be used, and good maintenance practices for instrumentation.
Typical Utilities Instrumentation
Cooling systems have the most instruments among typical plant utilities due to their relative complexity. Important readings can be taken on multiple loops and devices and in several key categories including temperature, pressure, power, and others such as flow or other supporting details like water treatment chemical concentrations, make-up water use, etc.
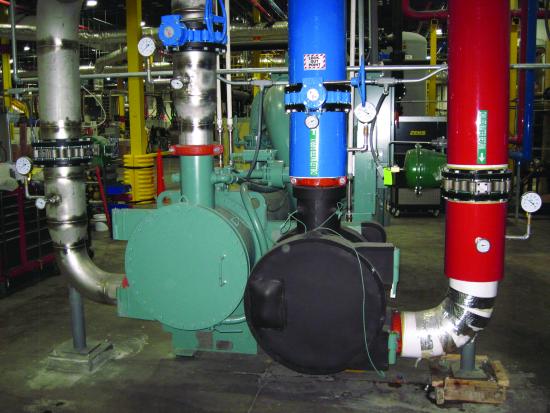
Examples of typical cooling system instrumentation: chiller gauges and line cooling gauges.
Other plant utilities similarly have vital readings although the range of types may be more limited. Compressed air and vacuum both have pressure (vacuum simply being an absolute pressure below atmospheric) and power. Compressed air may also have a flow meter and moisture level indication usually measured in dew point. Steam systems would most frequently have pressure as a combined indication of both pressure and temperature for saturated steam but may also have temperature independently for superheated applications, and condensate return would have temperature to reflect efficiency of heat retention in the return system.
The form of instruments may vary, ranging from discrete physical instruments such as individual thermometers and pressure gauges to electronic sensing & display devices, whether integral to equipment (such as those read on chiller or air compressor control screens) or stand-alone like temperature controllers often used on tower fans.
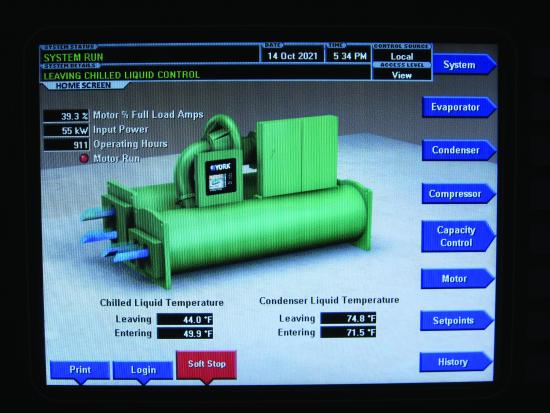
Multiple readings displayed on device control screens: a chiller panel display and an Advantage TCU with displays. Click to enlarge.
Returning to cooling systems, they will very frequently be instrumented at the in and out connections for major components such as pumps, chillers, heat exchangers, and process equipment. Critically missing in most cases are system-level sensors reflecting the overall cooling system conditions. These could include blended supply temperatures, where multiple devices (e.g. cooling towers, chillers, etc.) feed into common supply headers, and supply – return differential pressures, which provide the driving force for water flow through the various system cooling loads in the same way that voltage provides the impetus for electrical current flow.
It is important to remember that cooling in a given application is a function of two variables – both temperature and flow – and flow is only rarely measured. This is a major oversight because in addition to being a key component of the heat removal process, the pumping power to provide flow is typically the 2nd largest energy use in a cooling system besides the chillers. In fact, in around 20 - 25% of systems surveyed, the annual pumping energy exceeds the chiller energy due to the constancy of the pumping vs. the seasonal and production variations in chiller loading. Measuring flow can provide the basis for appropriate flow control, which is a significant opportunity for reduced equipment wear and great energy savings.
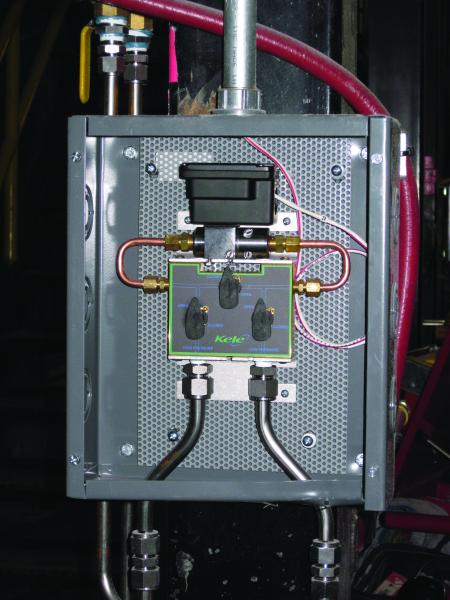
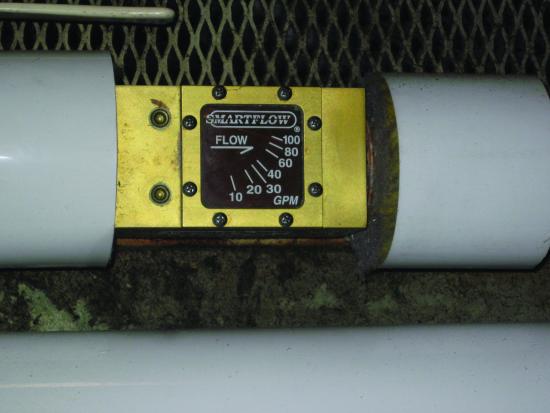
Cooling water differential pressure sensor and inline flow meters add greater depth to typical instrumentation.
Utilities Instrumentation Applications
Obviously, the primary use for instrumentation is to observe the operating status of equipment and systems. Is the chilled water cold enough? Are the pumps running within their amp limits? Is the supply pressure at or above the target for the compressed air system? Besides these primary and immediate uses, there are many advanced applications for instrumentation. Examples include:
- Benchmarking initial conditions of equipment operation for comparison with design performance expectations and future readings after service or repairs
- Assessing system loading and available capacity for expansion
- Correlating system conditions to production equipment performance for process optimization (e.g., quality troubleshooting and / or process improvement studies)
- Triggering preventive maintenance activities
For many uses, the data must be recorded over time and with sufficient reading quality for the data to be reliable for analysis. Operators tasked with collecting the data should be trained so that they understand both the meaning of the readings and the importance of ensuring that the readings are accurate. A knowledgeable technician will know when a reading is unusual or out of range and will either recheck the reading or flag the off normal condition for further review, both of which help ensure the quality and usefulness of the logged data.
One of the most powerful uses of instrument readings is through continuous data trends over time. When captured in a suitable datalogging system (whether temporary or permanent), trends support advanced purposes such as diagnosing changes in performance, identifying contributing factors to events, and flagging maintenance needs. The ability to trend readings is a key benefit to using electronic sensors vs. simply having individual physical sensors (gauges, thermometers, etc.), however it must be acknowledged that not all sensed points in a system can be cost effectively instrumented in this way.
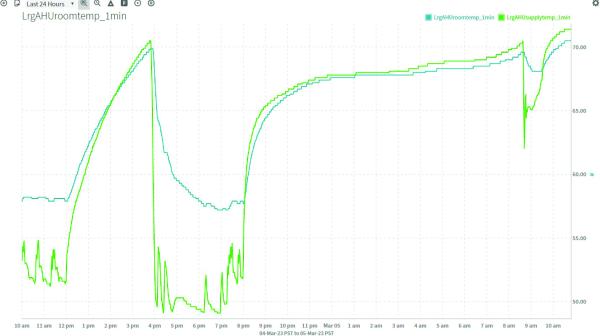
Example trends extracted from system controls and a chiller control panel. Click to enlarge.
Instrumentation Woes
While most plants have instruments installed as part of the facility construction or embedded in equipment, often very little attention is paid to the equipment installed or to maintaining it after the fact. And as noted above, it is usually only installed in the most typical locations leaving many key indications unavailable.
Further aggravating the relative lack of metering is the poor quality of most thermometers and pressure gauges installed in industrial systems. These are typically installed by a mechanical contractor as part of their system construction work scope, and unless there are clear quality standards included in the project specifications, the least expensive instruments available are used with the result that the initial readings are not particularly accurate and the long-term indications are almost certainly wrong by some degree.
Best Practices for Instrumentation
With a good understanding of the importance of instrumentation in cooling and other plant utility systems, the following Best Practices are recommended to provide the greatest benefits possible for system operations:
Best Practice Tip #1: Ensure operators are trained on the meaning of the instrument readings they record and on the importance of properly logging the data. No one likes doing meaningless tasks and untrained operators can’t identify off normal conditions, whether it’s a real equipment issue or simply an instrument error. The worst situation is having poorly recorded data such that important analysis and decisions are made while relying on bad information that is believed to be correct; this can lead to significantly costly errors in equipment purchases, system changes, etc.
Best Practice Tip #2: Install instruments to support specific, intentional uses above the basic default capabilities usually found. This means choosing to install additional gauges and / or sensors and either logging them manually on a consistent, regular basis (as with all the other monitored points) or else tying them into monitoring and logging systems.
Examples of these would be differential pressures at different points, flows on separate loops, blended branch header temperatures, and other indications that give insight into system conditions beyond specific device readings. The locations and types of readings for these would come from a clear understanding of the underlying system, and it may be worth consulting with a systems specialist to identify what points and instruments would be most helpful.
Best Practice Tip #3: Consider setting different reading frequencies for various points to reduce the operator data logging workload. Certain values need to be read every time logging is done while others may be reasonably read on a less frequent basis. For example, the in and out water temperatures and the average amps or kW power2 should be recorded every time a chiller is read, (potentially daily or even multiple times each day) while the individual phase amp readings, refrigerant conditions (either temperature or pressure), phase voltages, etc. could be read two or three times each week and still be very useful.
Of course, automated monitoring systems would perform the readings with no meaningful penalty for consistent, complete logging each time.
Best Practice Tip #4: Project specifications should include specific quality and accuracy requirements for pressure gauges and thermometers such that “better” quality instruments are used, typically a +/- 1% or better accuracy rating. There is no need for the expense of NIST-calibrated metering for general industrial applications, although boiler pressure or other safety-related metering may appropriately be of this quality and have periodic calibration performed to ensure long-term accuracy.
Typical light-duty pressure gauges with a 2 – 3% initial accuracy may list for $20 – 25 while a higher quality, liquid-filled HVAC / light industrial gauge with 1% accuracy may list for $50 – 70. For a mechanical room with thirty gauges, the initial cost premium might be $1500 but the readings will be more accurate and the gauges will last longer.
Note that the total range of the device must be considered in addition to the accuracy. A +/- 1% accuracy thermometer with a 0 - 300°F range will have a +/- 3°F allowable error band while still meeting spec. This means that a plate heat exchanger providing 6°F of cooling could show zero temperature change if the inlet thermometer was reading 3°F low and the outlet thermometer was reading 3°F high. If 0 - 100°F range thermometers with the same +/- 1% accuracy were being used, at least 4°F of cooling would be shown. (See BP Tip #6 below on cross checking.)
Best Practice Tip #5: Manifold pressure gauges to share a single gauge per device such as a pump, chiller, or heat exchanger. This improves the accuracy of differential readings while reducing cost and part count of gauges since the gauge error will be proportionally consistent across all the measured points. For example, a single gauge manifolded across a chiller evaporator will give a better indication of the true pressure difference between the inlet and outlet than two separate gauges, each with their own possible error.
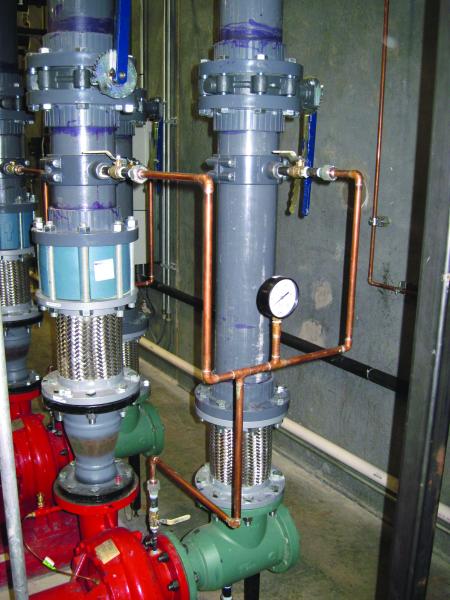
Pump pressures manifolded to a single gauge.
Best Practice Tip #6: Cross check thermometers periodically to minimize temperature reading errors. While manifolding pressure gauges is helpful to minimizing error in pressure readings, temperatures can’t be connected in the same way to a common instrument. Also it would not be time efficient to move a single thermometer from place to place. Accordingly, the best solution for thermometers is to periodically cross check them and note the differences.
This can be done in place, for example by flowing water through just one side of a heat exchanger or off-line chiller and noting the differences in the readings (in theory they should be identical if there is no heat load being transferred). Removable thermometers (See BP Tip #8 below) can be read while inserted into a water container and the respective readings noted. Some thermometers have scale adjustment capability and these should be adjusted either to match a reference thermometer (if available) or at least to consistency among the group.
Best Practice Tip #7: Install blowdown piping for gauge ports, particularly on open loop tower water connections. An easily used blowdown makes regular purging of the sensing leg easy such that it will be done routinely. Water systems are frequently subject to particulate loading, for example through open tanks or direct contact cooling applications, and even water that looks clean will foul and plug gauge taps if not periodically cleaned.
![]()
![]()
Pressure sensors showing both manual and solenoid operated blowdowns.
Best Practice Tip #8: Install sensors with isolation capability between the system and measurement devices (gauges, etc.) so they can be serviced without interruption of the system operation. This means thermometers with thermowells, isolation valves on pressure monitoring locations, etc.
Insertion flow meters can often be installed using valves where they can be removed while the line stays in service or they can be selected as through the pipe wall technology (e.g. ultrasonic); in either case, they can be serviced if needed without affecting the line operation.
For pressure sensing on tower water piping, in particular, it is important that the isolation valve be in the sensing leg directly perpendicular to the main pipe – unfortunately this is seldom done and many pressure gauges we’ve seen on tower systems are essentially useless as they have been plugged for years. When combined with the blowdown piping recommendations in Tip #5 or #7, the pressure readings should be good for the long term.
Conclusion
Proper instrumentation is critical to understanding how plant utilities are operating and evolving over time. Taking steps to insure the readings are accurate and consistent dramatically increases the reliability and usefulness of the collected data.
One key distinction of the industrial utilities environment (versus commercial or other applications which may employ the same systems) is that they change over time. Plants are expanded, new lines or processes are brought in, etc., and these changes make understanding the support utilities critical, not only to daily operations and equipment maintenance, but also to accurately understanding the utilities usage relative to production and for reliably forecasting the needs for additional utility capacity as these changes occur.
1There are of course numerous similar and more detailed measurements taken when needed on a patient, many of which also essentially indicate the person’s physical performance and efficiency.
2Power is a much better indicator than amps given that the amps will run above 35 – 40% of full load on a completely unloaded motor while the real power (kW or HP) will be 5% or less of the rated shaft output. Real power tells the actual input work into a system making it immediately obvious if a coupling has failed, etc. and much more insightful when evaluating the operation of a device or system.
For questions or more information about Integrated Services Group visit https://www.isg-energy.com, email: info@isg-energy.com, tel: 770.823.8235.
For similar articles on Cooling Controls System Assessments please visit https://coolingbestpractices.com/system-assessments/cooling-controls.
Visit our Webinar Archives to listen to expert presentations on Cooling Technology at
https://coolingbestpractices.com/magazine/webinars.